last updated: Dec. 18, 2014

CREATING YOUR OWN INFOGRAPHIC
5 Unbeatable Types of Infographic and Free Tools to Create Them- Search Engine Journal has provided very useful information
5 Unbeatable Types of Infographic and Free Tools to Create Them- Search Engine Journal has provided very useful information
10 Awesome Free Tools to Make Infographics- from Makeuseof.com; list of tutorials and program
19 Word Cloud Resources, Tips, and Tools- from Shelly Terrell's Teacher Reboot Camp
DIY Infographic Production- instructions in the form of what else, an infographic
Find and Make Your Own Infographic With Visual.ly
How to Create an Infographic- 12 steps
How to Create Modern Outstanding Infographics- step-by-step tutorial using Adobe Illustrator
How to Create a Textural Video Infographic- from Brainshark
Infographics as a Creative Assessment from Kathy Schrock on Vimeo.
Make Your Own Infographic- from Wild Apricot Blog

FREE TOOLS TO MAKE AN INFOGRAPHIC
AmCharts- flash and java script charts
Barchart- simple tool to use
Beam- from Venngage
Bubbl.us- create colorful mind maps
Cacoo- create diagrams online
AmCharts- flash and java script charts
Barchart- simple tool to use
Beam- from Venngage
Bubbl.us- create colorful mind maps
Cacoo- create diagrams online
ChartGizmo- online chart builder
ChartGo- input your information and create your chart
Chartle- simple and interactive charts
ChartPart- chart generator
Crappy Graphs!- very easy way to make graphs
Create a Graph- from Kids' Zone; easy to use
Free Vector World Maps Collection- high resolution world map images
Gapminder Desktop- show global trends with this downloadable program; very nice!
Gliffy- online diagram and flowchart software
Google Chart Tools- gallery of interactive charts and data tools.
Google Chart Tools- gallery of interactive charts and data tools.
Google Public Data- use public data and turn it into an infographic
Gunn Map-paste in your data and create your custom world map
Inkscape- Open Source vector graphic software
Lovely Charts- diagrams and flowcharts
Lucid Chart- online diagram and flow chart
Lovely Charts- diagrams and flowcharts
Lucid Chart- online diagram and flow chart
Make Sweet- create Venn diagrams
Many Eyes-create your visualization by uploading information
Mind 42- mind mapping
Pie Color- make a pie chart in 2D or 3D
Piktochart- presentation tool; free and $$ accounts
PosterMyWall- classroom accounts are free
Pretty Graph
Pie Color- make a pie chart in 2D or 3D
Piktochart- presentation tool; free and $$ accounts
PosterMyWall- classroom accounts are free
Pretty Graph
Statplanet- "browser-based interactive data visualization and mapping application."
Tableau- create visualizations; download required; only Windows available
Tagxedo- word clouds; more features than Wordle
ThingLink- make your images interactive
Venngage- excellent templates; education pricing, free accounts
Visualize Everything: 32 Free Tools to Create Different Diagrams
What is an Infographic?- explained simply with Legos
ThingLink- make your images interactive
Venngage- excellent templates; education pricing, free accounts
Visualize Everything: 32 Free Tools to Create Different Diagrams
What is an Infographic?- explained simply with Legos
Wordle- create word clouds
40 Useful and Creative Infographics- you'll find A Year in Iraq, Evolution of the Household, On Driving: Automobile History and Our Favorite Drugs.
60 Creative Examples of Infographics- includes The Global Tobacco Trade, What Countries Invest the Most in Alternative Energy? and The Periodic Table of Typefaces.
Cool Infographics- nice collection, including the Caffeine Poster, Are You Vitamin D Deficient and The Brutal Decline of Yahoo!
DataViz- includes The Colors on the Web, The Cost Efficiency of Transportation and A Modern History of Human Communication.
Fast Company- large collection includes How the Brain Reacts When We Have Too Much to Do, The Physics of Oil Spills, Rich Countries Have an Aging Problem and Who Drives Worse, Teens, or Seniors?
Infographic World- view their portfolio; the 24 graphics are really good!
Visual Complexity- close to 700 projects in the collection; you can easily search for what you need.
Visual.ly- infographics and visualizations; HUGE collection
Visualizing.org- share or view infographics
SUBJECT AREAS
How Infographics Accelerate Learning
How to Get Better Grades Using Social Media
How Stress Can Hurt Your Test Scores
How Students Pay for College
How to Get Better Grades Using Social Media
How Stress Can Hurt Your Test Scores
How Students Pay for College
Teaching With Infographics: Places to Start- from the New York Times; examples shared over five days. Includes a section on the page entitled "Places to Start Learning About Infographics."
HEALTH and NUTRITION
7 Allergens in Your Home
17 Educational Infographics to Learn About Reproductive Health-includes Teen Pregnancy in America, Abortion State-By-State, STDs in America and Porn and the Economy.
The Addiction Process: How We Get Addicted
Amazing Facts About the Human Body
The Anatomy of Cancer
Anti-Inflammatory Pyramid
Carrots Used to Be Purple?
The Changing Face of A.I.D.S.
Chemicals in Cigarette Smoke
The Complete Guide to Workout Nutrition
The Eat Well Plate
The Embarrassing Lack of Clean Water Access in the World
The Facts About Heart Disease
The Changing Face of A.I.D.S.
Chemicals in Cigarette Smoke
The Complete Guide to Workout Nutrition
The Eat Well Plate
The Embarrassing Lack of Clean Water Access in the World
The Facts About Heart Disease
How Healthy is Your City, State or Country?- topics covered include obesity, environmental issues, diseases and addictions and other issues.
How Soft Drinks Impact Your Health
The Kid's Activity Pyramid
Lung Cancer Facts
Mediterranean Pyramid
How Soft Drinks Impact Your Health
The Kid's Activity Pyramid
Lung Cancer Facts
Mediterranean Pyramid
The Truth About Alcoholism
The Vegan Food Pyramid
The Vegetarian Pyramid
Why You Are an STD Risk
HISTORY / SOCUAL STUDIES / GEOGRAPHY / CURRENT EVENTS
The Vegan Food Pyramid
The Vegetarian Pyramid
Why You Are an STD Risk
HISTORY / SOCUAL STUDIES / GEOGRAPHY / CURRENT EVENTS
Flowing Data-collection includes the Kennedy family tree, Evolution of the Two-Party Vote During the Past Century and What Generation Do You Belong To?
Inside Fukushima's Nuclear Reactors
Japan Crisis
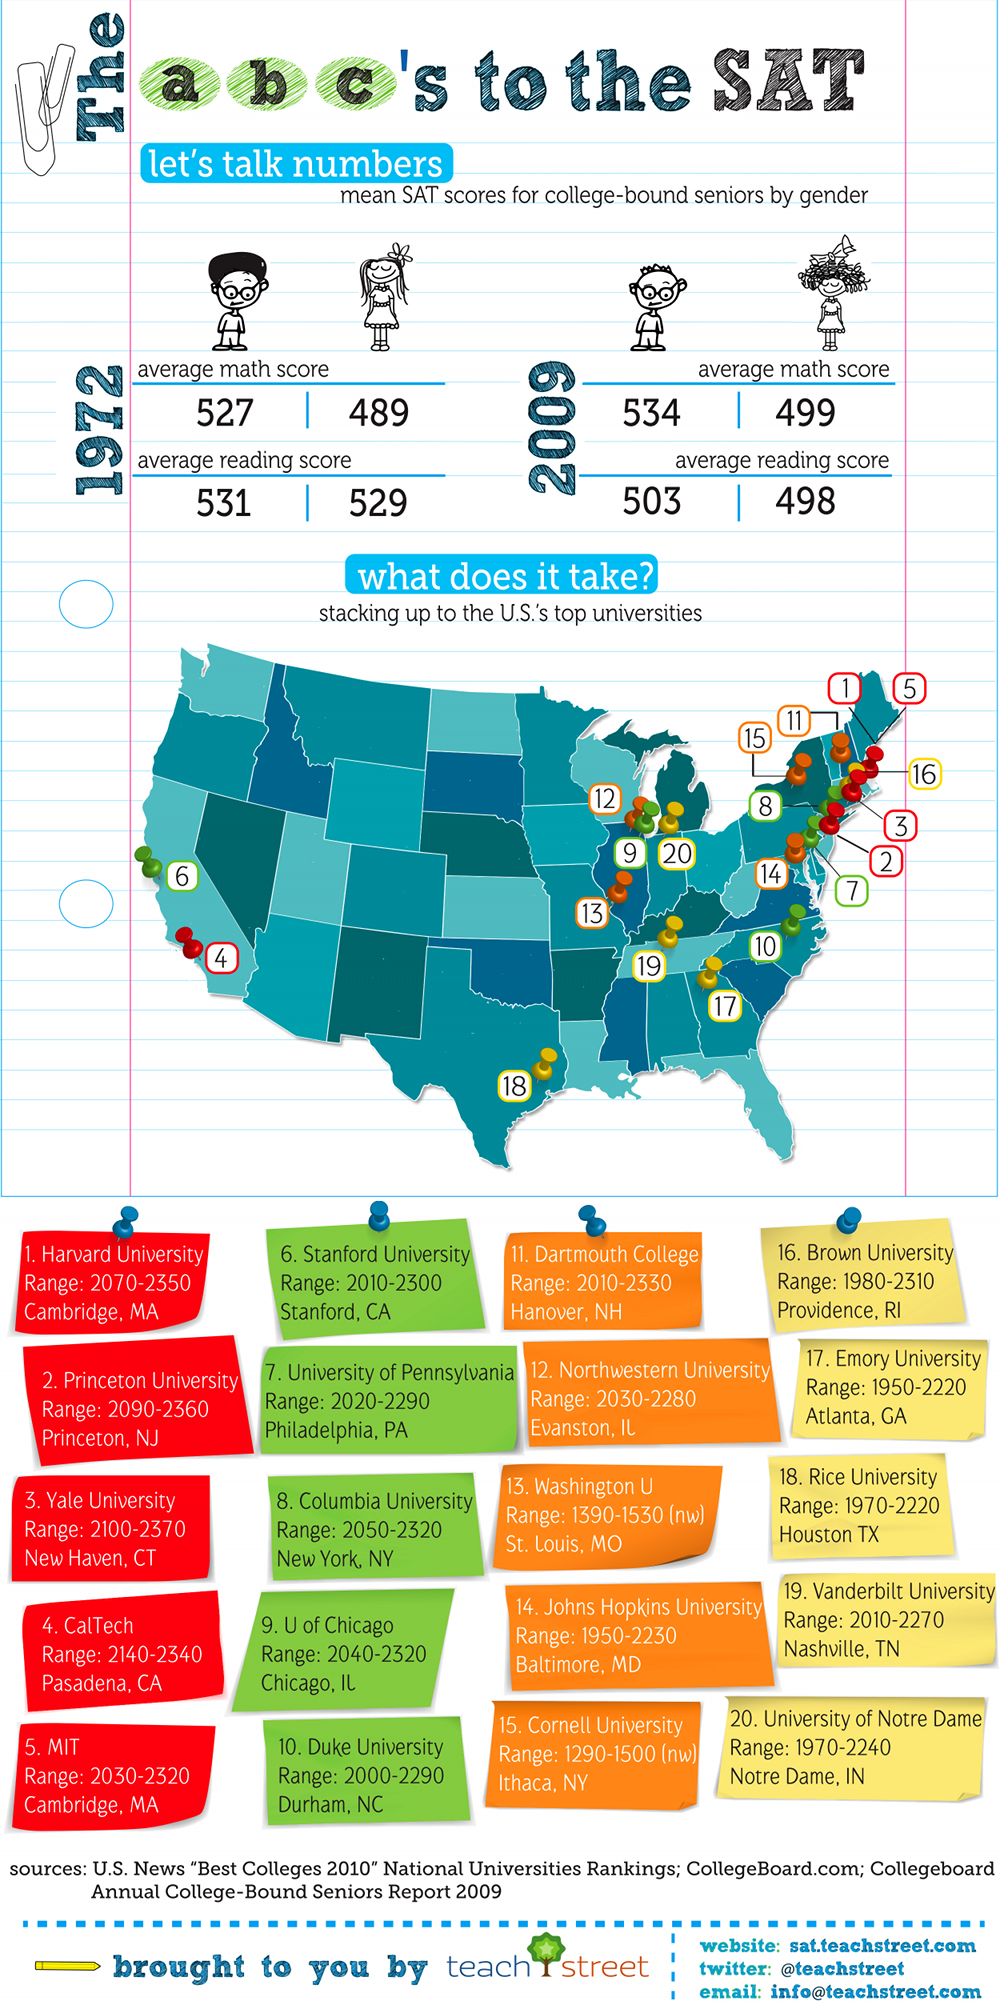
Presidential College Map of The United States of America
Japan Crisis
Presidential College Map of The United States of America
Simple Complexity- samples include Misleading Statistics, Berlin Wall, and Government Expenses Worldwide by GDP.
What Does Your State Do Worst?- from crime to pollution each state is labeled in this infographic
What Part of Legal Immigration Don't You Understand?
Where in the World Are Exiled Leaders?
What Part of Legal Immigration Don't You Understand?
Where in the World Are Exiled Leaders?
LANGUAGE ARTS
10 Commonly Misunderstood Words in English
28 Boring Words and What to Use Instead
A Literary Map of Manhattan- cool interactive infographic
Spell Check
Storytelling Isn't Just for Campfires
Troublesome Words
Verbs with Prepositions
10 Commonly Misunderstood Words in English
28 Boring Words and What to Use Instead
A Literary Map of Manhattan- cool interactive infographic
Spell Check
Storytelling Isn't Just for Campfires
Troublesome Words
Verbs with Prepositions
27 Things Your Teacher-Librarian Does
29 Ways to Stay Creative
ABCs of Information Literacy
All Digital Citizens
29 Ways to Stay Creative
ABCs of Information Literacy
All Digital Citizens
Anatomy of a Librarian
The Aroma of Books
At-A-Glance Comic Tutorials- from the wonderful Daring Librarian
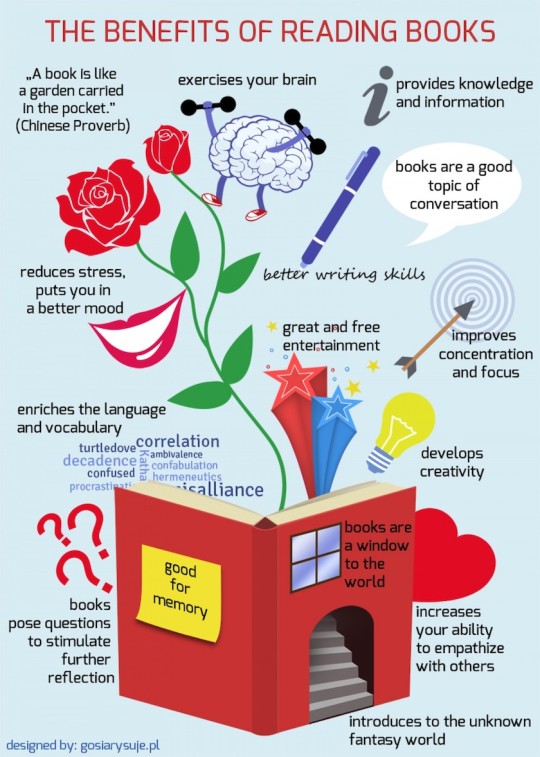
The Benefits of Reading Books
The Aroma of Books
At-A-Glance Comic Tutorials- from the wonderful Daring Librarian
The Benefits of Reading Books
Books VS eBooks
Books Make a Difference in Kids' Lives: The Haves and the Have Nots
Bookworms
Bye-Bye Textbooks: How Digital Devices Are Reshaping Education
Classification Chart: Readers
Components of a 21st Century Classroom
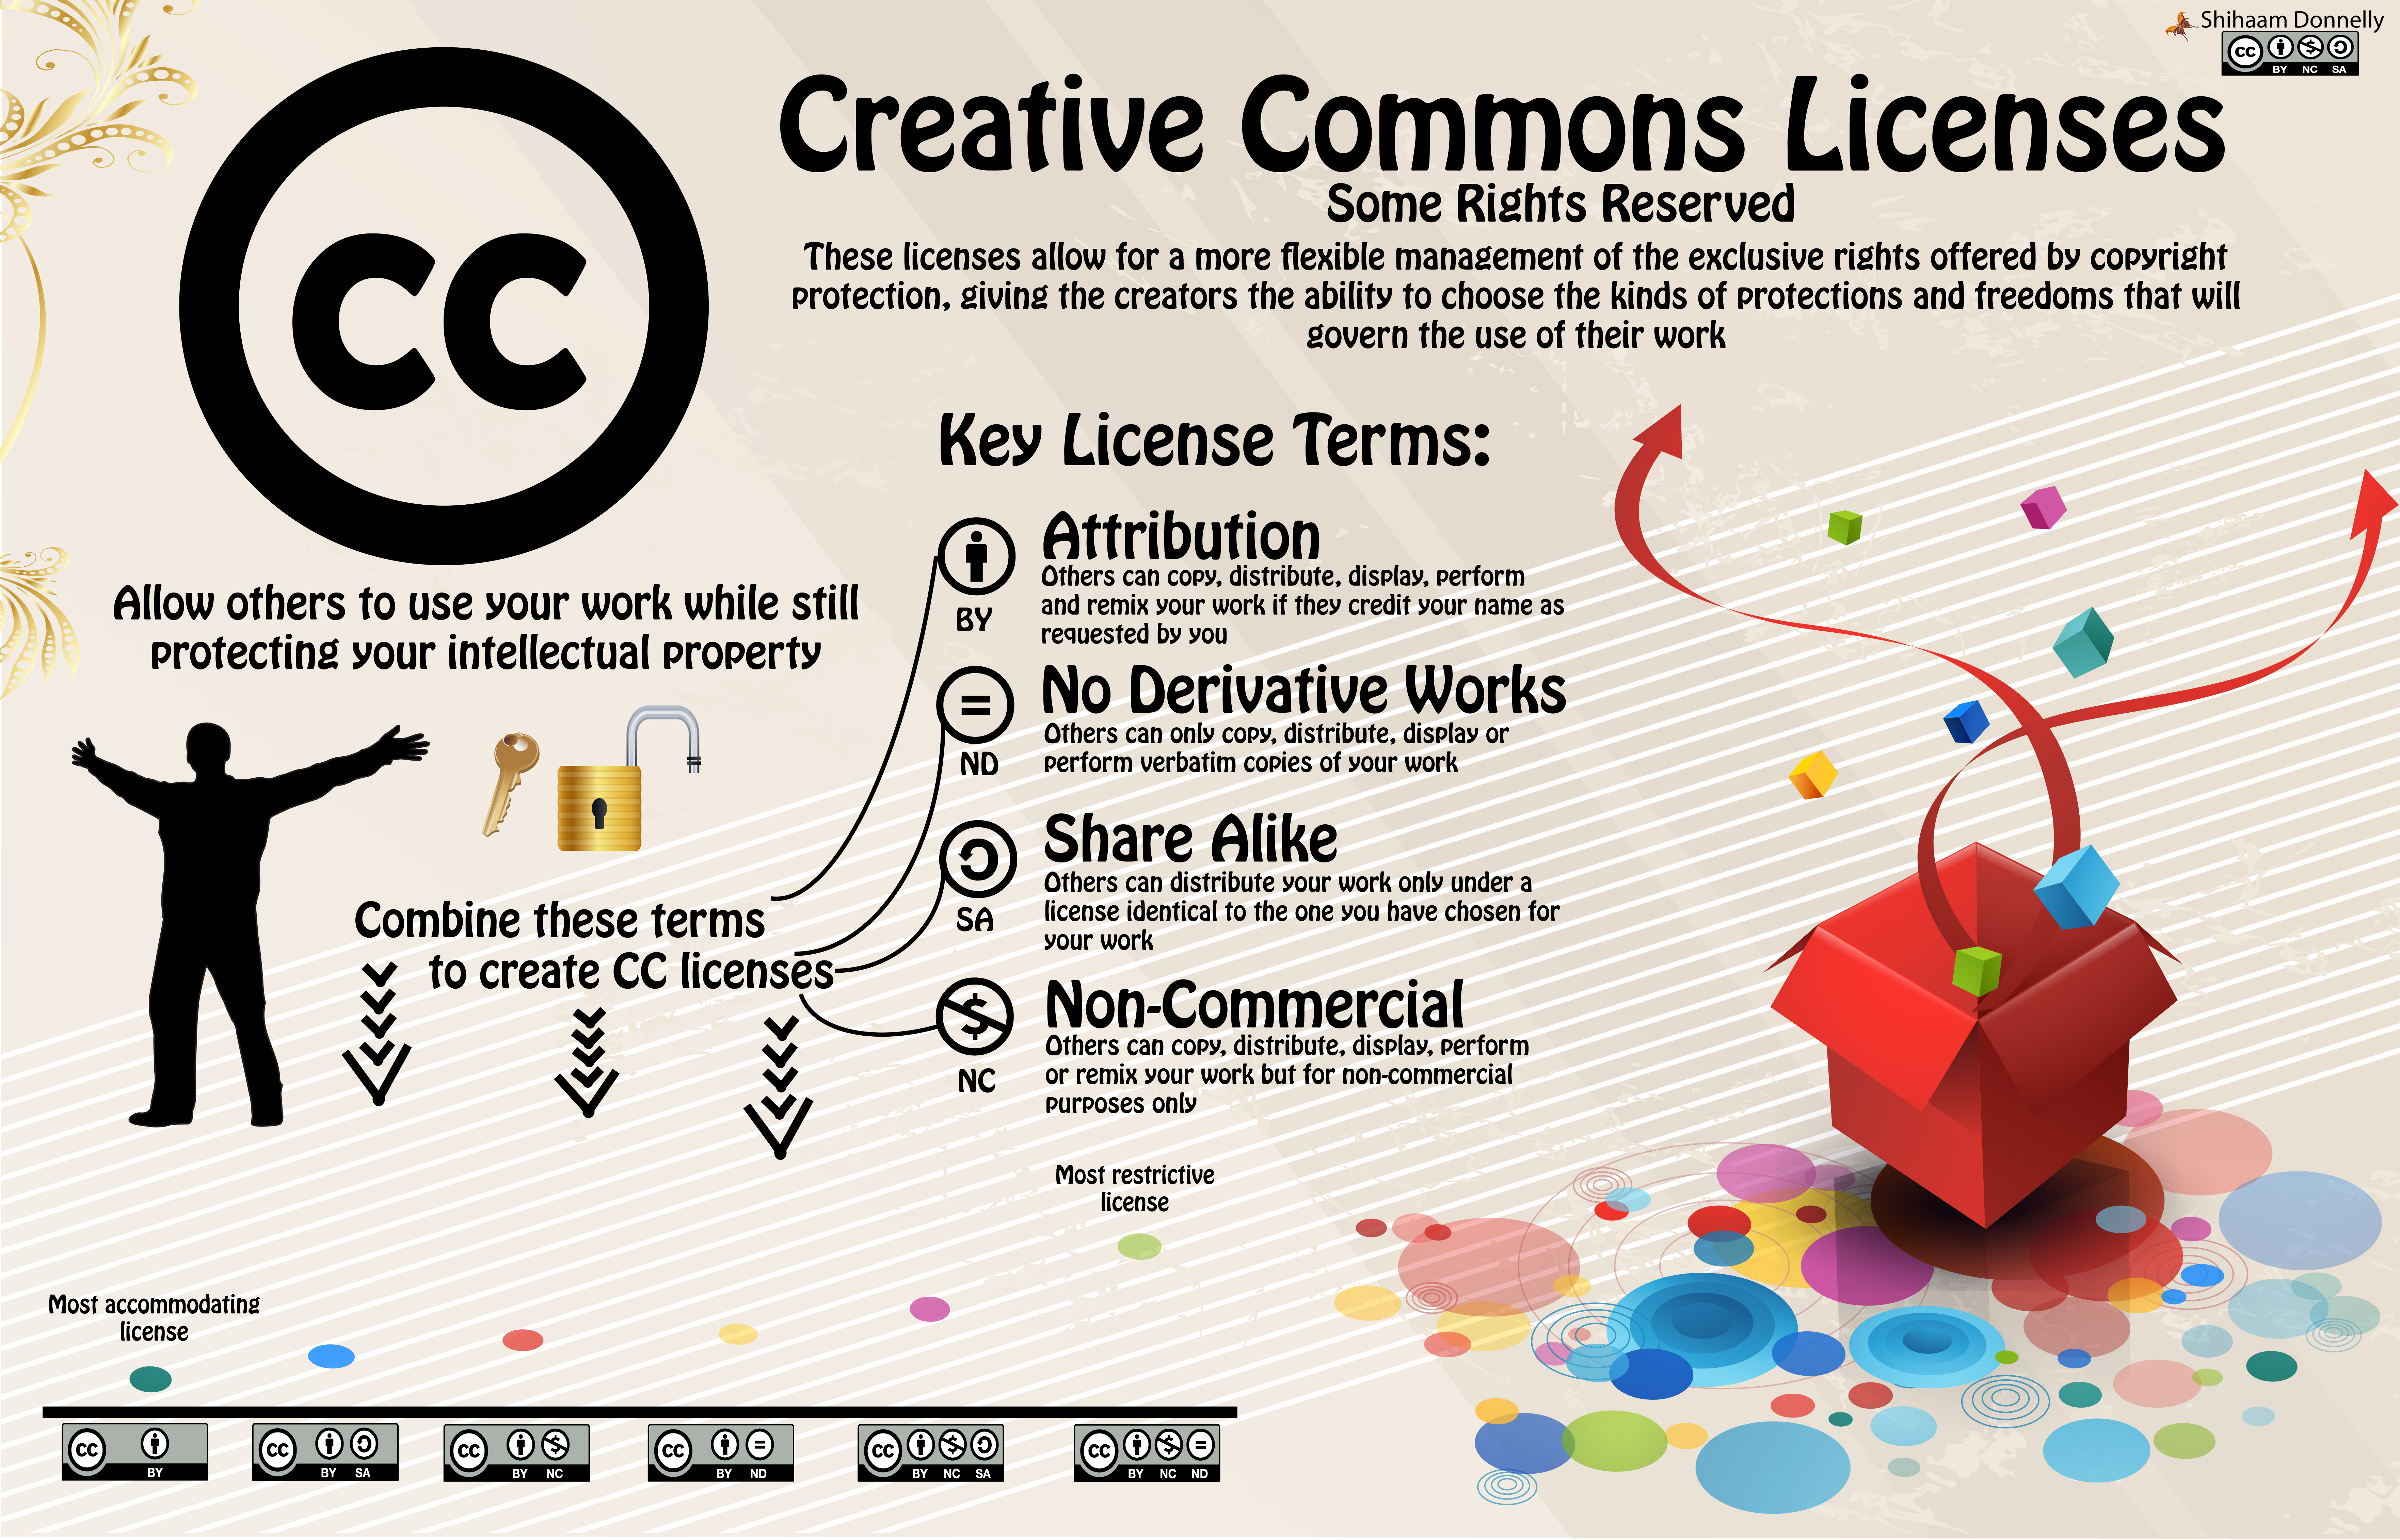
Creative Commons Infographic
Books Make a Difference in Kids' Lives: The Haves and the Have Nots
Bookworms
Bye-Bye Textbooks: How Digital Devices Are Reshaping Education
Classification Chart: Readers
Components of a 21st Century Classroom
Creative Commons Infographic
The Evolution of Typography
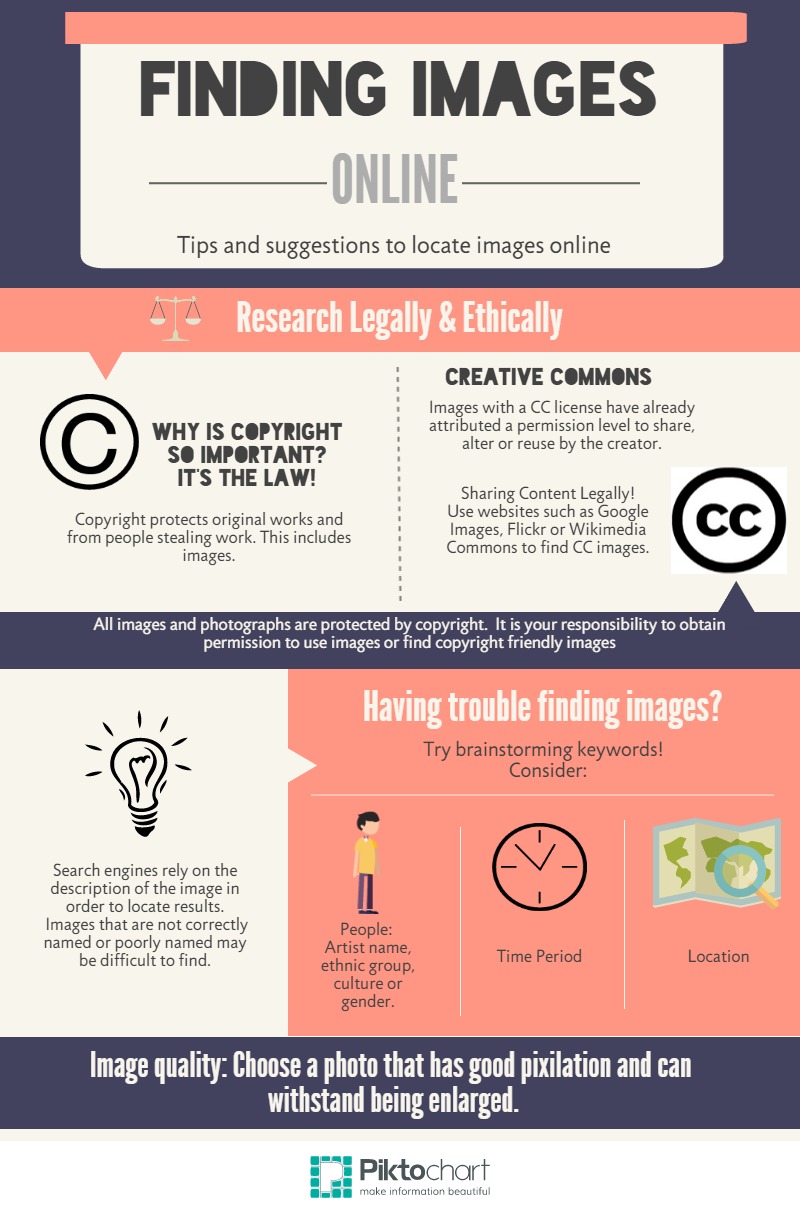
Finding Online Images
Formatting Your Research Paper
A General Guide to Understanding Plagiarism- EASYBIB
Google Search Genius
Guide for Your Research Paper
The History of e-Mail
Finding Online Images
Formatting Your Research Paper
A General Guide to Understanding Plagiarism- EASYBIB
Google Search Genius
Guide for Your Research Paper
The History of e-Mail
How Google Works
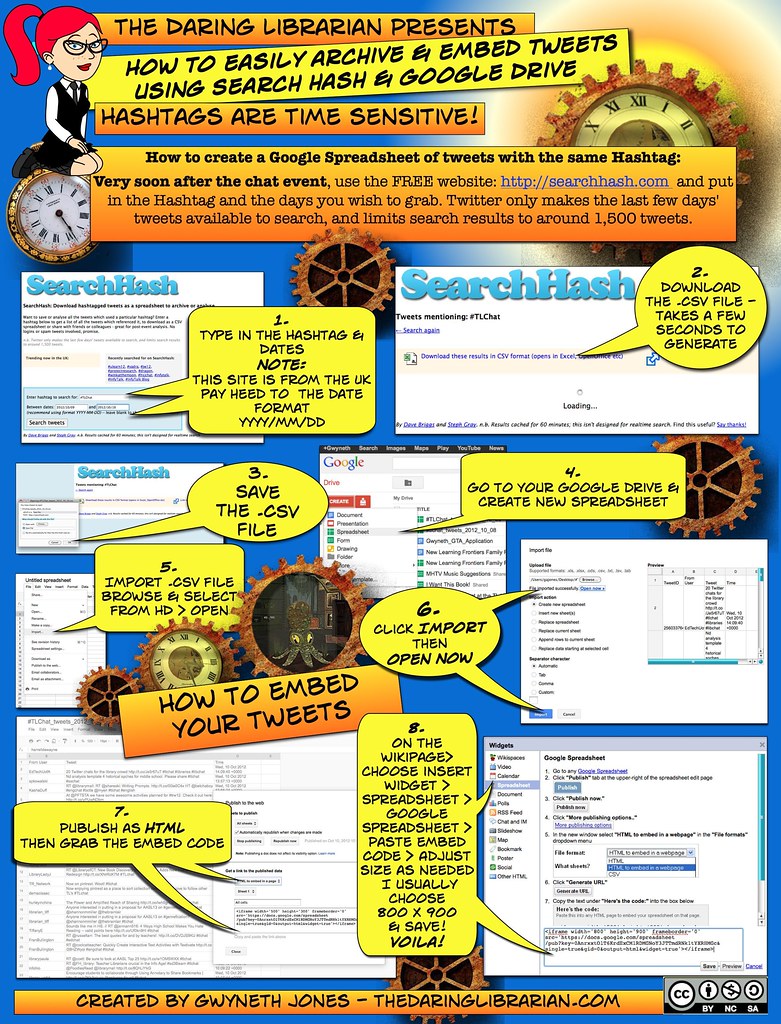
How to Easily Archive and Embed Tweets Using Search Hash & Google Drive- Daring Librarian
How to Easily Archive and Embed Tweets Using Search Hash & Google Drive- Daring Librarian
A Librarian's Worth Around the World
Library of Congress By Numbers
The Literary Crisis and Kids in America
Library of Congress By Numbers
The Literary Crisis and Kids in America
Most Targeted Books
Myth #4: Librarians Have a Lot of Time to Read
On the Road to Reading
Plagiarism: A Visual Guide
The Power of Reading to Your Children
The Power of Stories and Reading to Spark Children's Potential
Myth #4: Librarians Have a Lot of Time to Read
On the Road to Reading
Plagiarism: A Visual Guide
The Power of Reading to Your Children
The Power of Stories and Reading to Spark Children's Potential
Publishing in the Digital Era
Questions a Critical Thinker Asks
Reading Like a Sleuth
The Rise of eReading
Students Like Social Media
Three Types of Copyright
Questions a Critical Thinker Asks
Reading Like a Sleuth
The Rise of eReading
Students Like Social Media
Three Types of Copyright
17 Things You Didn't Know About the Brain
2010's Most Threatened Animal Species
Anatomy of a Hurricane
2010's Most Threatened Animal Species
Anatomy of a Hurricane
How We Use Our Brains
The Hubble Telescope
Language and Your Brain
Missions to Mars
The Most Dangerous Species in the Mediterranean
Multitasking: This is Your Brain on Media
Renewable Energy Sources
Shark Ecosystem
The Hubble Telescope
Language and Your Brain
Missions to Mars
The Most Dangerous Species in the Mediterranean
Multitasking: This is Your Brain on Media
Renewable Energy Sources
Shark Ecosystem
35 Great Social Media Infographics
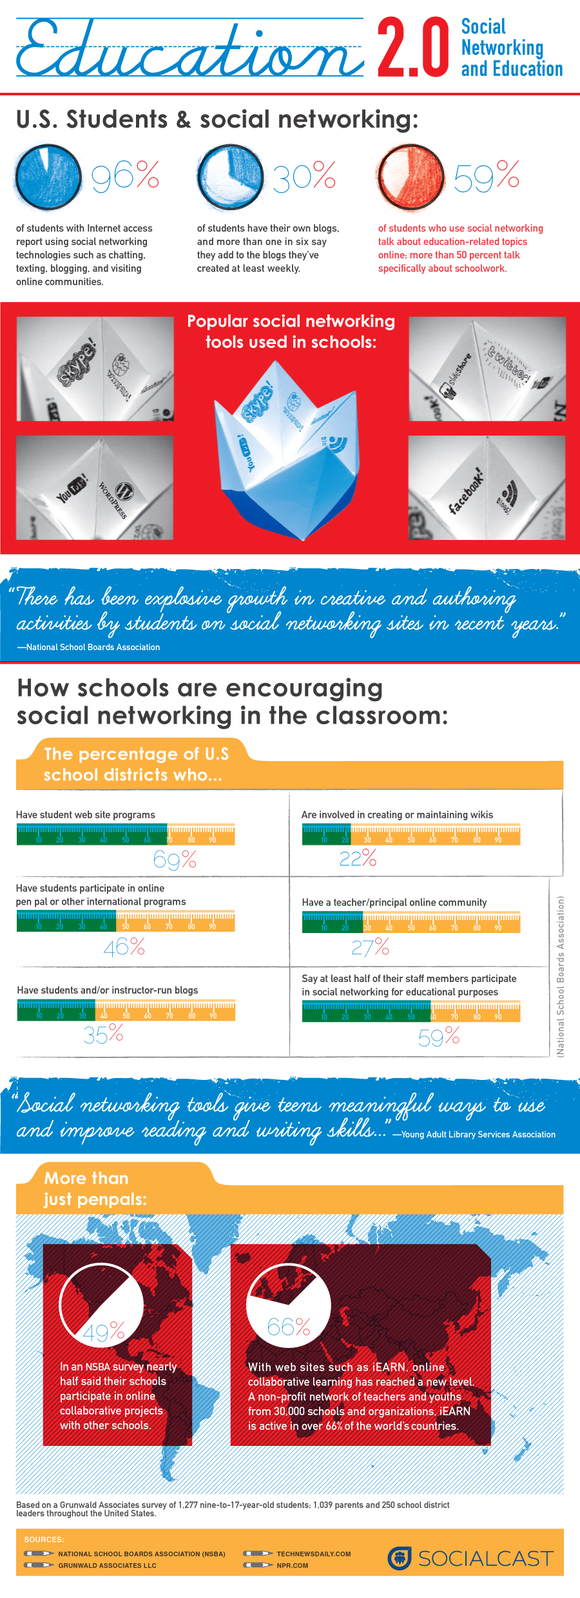
Education 2.0: Social Networking and Education- infographic
How College Professors Use Social Media- infographic
How Does the World of Social Networking Compare to High School?
How to Get Better Grades Using Social Media- infographic
How Social Media is Reshaping College Admissions
Is Social Media Ruining Students?- infographic
The Social Media Stars of 2011
Internet Speeds Around the World
The Open Cloud Platform
State of the Internet 2011- interactive infographic
Students Love Technology
Technological Revolution!
The Open Cloud Platform
State of the Internet 2011- interactive infographic
Students Love Technology
Technological Revolution!
PIKTOCHART VIDEO TUTORIALS (7)
How to Turn Infographics into Effective Teaching Tools- from Visual.ly's blog
Infographics as a Creative Assessment- huge listing includes books, web resources and videos from Kathy Schrock
Infographics Lesson
Seven Essentials of Good Infographic Design- great tips from Free Technology For Teachers
Teaching Visual Literacy- for middle school
Teaching With Infographics: A Student Project Model- from New York Times Learning Network
Teaching With Infographics: Places to Start- New York Times Learning Network; includes TED video of David McCandless
Ways to Teach Using Infographics-from Educational Technology and Mobile Learning
